🧭 LangGraph4j Hooks and OpenTelemetry
Why Observability Matters
Agentic workflows are dynamic: nodes may run conditionally, in parallel, or be skipped entirely. When something fails, a simple stack trace is rarely enough. Observability gives you a unified view of what happened, where it happened, and why.
In practice, observability helps you:
- Understand end-to-end execution flow.
- Detect performance bottlenecks early.
- Correlate errors with specific nodes, edges, and state transitions.
Why Telemetry Matters
Observability is only possible if you collect high‑quality telemetry. Telemetry is the raw signal: traces, logs, and metrics. Without it, probably, you are debugging your system partially.
In agent graphs, telemetry becomes even more important because state and control flow are distributed across steps. The same workflow can behave differently depending on state, configuration, or external tool results.
The LangGraph4j hooks
LangGraph4j hooks are small, composable interceptors that sit around nodes and conditional edges. They let you run custom logic before, after, or wrapping the core action, without modifying the node itself.
Hooks can be registered globally (applies to all nodes/edges) or by ID (targeted to a specific node/edge), and their execution order is LIFO(Last In First Out) for BeforeCall/AfterCall, FIFO(First In First Out) for WrapCall.
This makes them a precise, low‑friction mechanism for cross‑cutting concerns like tracing, metrics, logging, or state inspection.
How Hooks Enable Observability
Hooks provide lifecycle interception points around node and edge execution. This is the ideal place to add logging, metrics, or traces without contaminating business logic.
In LangGraph4j you can intercept execution before, after, or around node/edge calls. Here is a minimal example that measures node execution time and logs it:
var graph = new StateGraph<>(MyState.SCHEMA, serializer)
    .addWrapCallNodeHook((nodeId, state, config, action) -> { // add Wrap call node hook
        var start = System.currentTimeMillis();
        return action.call()
            .whenComplete((res, err) -> {
                var ms = System.currentTimeMillis() - start;
                log.info("node '{}' took {}ms", nodeId, ms );
            });
    })
    .addNode( "node1", action1 )
    .addNode( "node2", action2 )
    ....
    .compile();
This pattern scales: you can plug in structured logs, metrics counters, or spans with the same hook mechanism.
OpenTelemetry in the Java Ecosystem
OpenTelemetry is the standard for observability across modern platforms. In Java it provides:
- Tracing via spans
- Metrics via meters
- Logs via instrumentation
You configure it once and export telemetry to a backend like Jaeger, Grafana, or the OpenTelemetry Collector. The key benefit here is portability: you are not locked to a single vendor.
How LangGraph4j Hooks Enable OpenTelemetry
LangGraph4j includes a dedicated module, langgraph4j-opentelemetry, that provides hook implementations ready for tracing node and edge execution. Consider it as a reference implementation about how to integrate OpenTelemetry in LangGraph4j
The module includes:
OTELWrapCallTraceHook: creates spans for each node and edge call, adding config/state attributes and start/end events.OTELWrapCallTraceSetParentHook: creates a parent span so node/edge spans are grouped inside a workflow scope.
A minimal integration looks like this:
var otelHook = new OTELWrapCallTraceHook<MyState>(serializer);
var parentHook = OTELWrapCallTraceSetParentHook.<MyState>builder()
    .scope("MyWorkflow")
    .groupName("stream")
    .build();

var workflow = new StateGraph<>(MyState.SCHEMA, serializer)
    .addWrapCallNodeHook(otelHook)
    .addWrapCallEdgeHook(otelHook)
    .addWrapCallNodeHook(parentHook)
    .addWrapCallEdgeHook(parentHook)
    .addNode( "node1", action1 )
    .addNode( "node2", action2 )
    .addContitionalEdges( "node2", edgeAction,
            EdgeMappings.builder()
            .to("node1")
            .toEnd()
            .build() )
    ...
    .compile();
This keeps node logic clean while producing rich, correlated traces for the entire workflow.
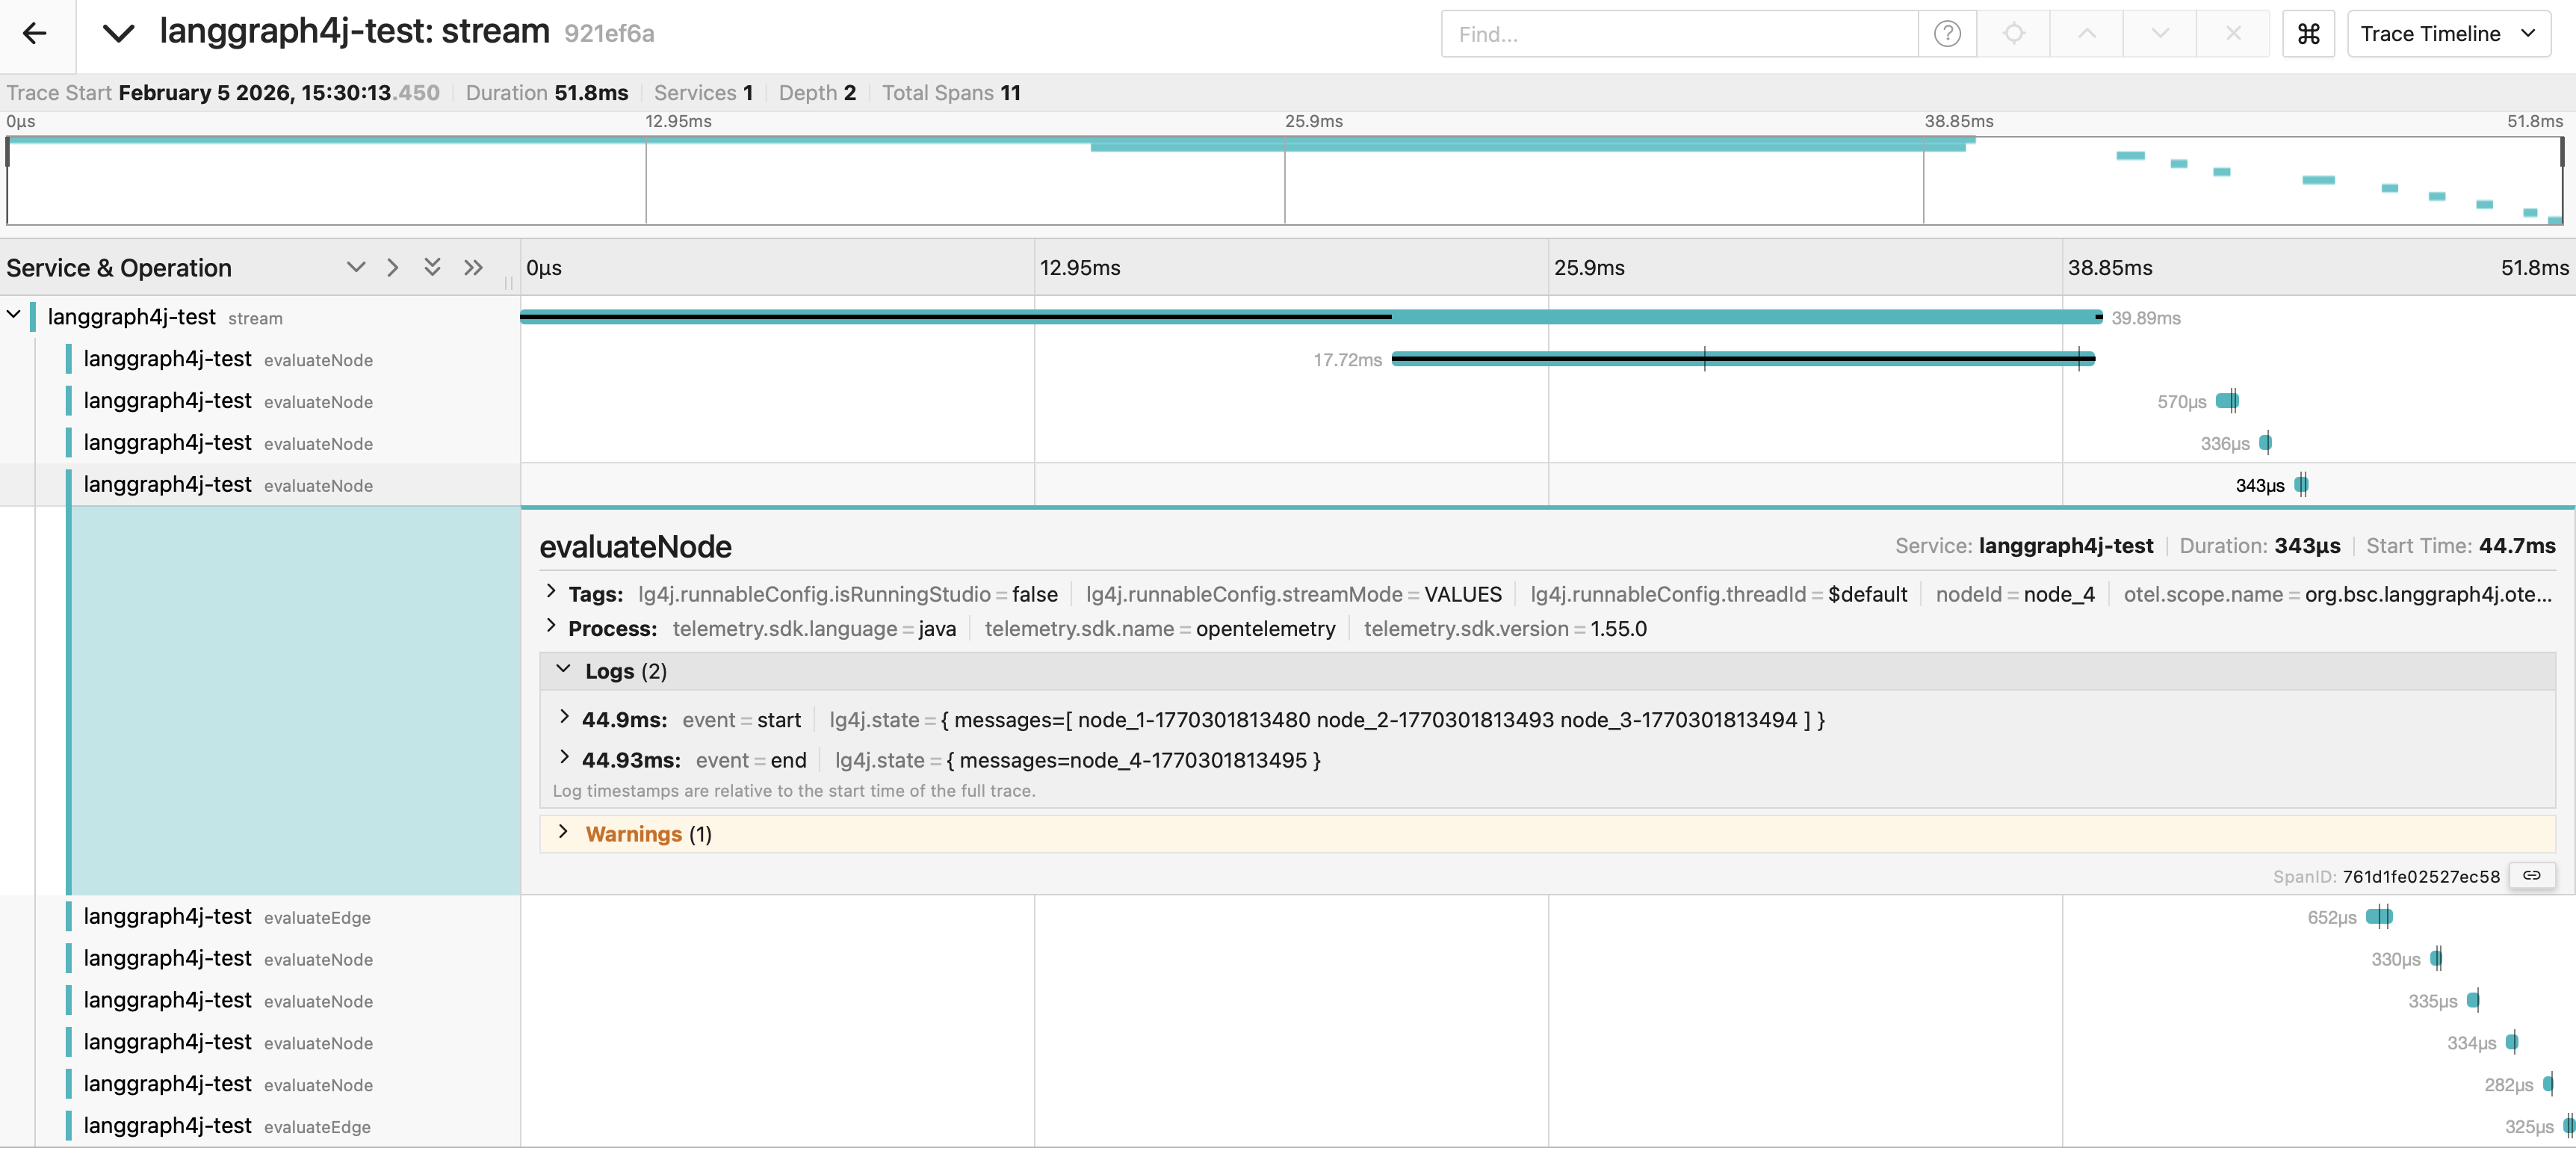
Below an example of output in Jaeger tracing platform
Conclusion
Hooks are the foundation for observability in LangGraph4j: they give you structured interception points without affect your main workflow code. OpenTelemetry builds on top of this by standardizing how telemetry is collected and exported in the Java ecosystem. Combined, they deliver production-grade visibility for complex agent workflows. Checkout project, try it and let me know your feedback and … happy AI coding! 👋